Network Flow Analysis of Time Series
In addition to allowing generation of graphs from single data layers, the Connectivity Analysis Toolkit also allows creation of graphs from a series of related layers of identical dimensions. These are typically 'time series' depicting e.g., how a landscape's suitability for a species is projected to change over time (with climate change, forest succession, or restoration). Phillips et al. (2008) (
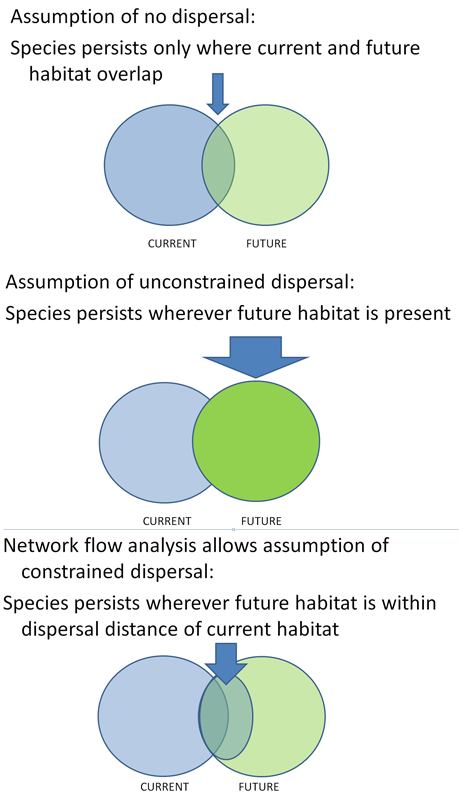
pdf) applied this method to identify 'climate corridors' for endemic plants in South Africa's Cape Province. Under their model, a species could persist if a currently suitable site either remained suitable under future climates or was adjacent to future suitable sites, allowing dispersal to new areas even if the current site was no longer suitable.
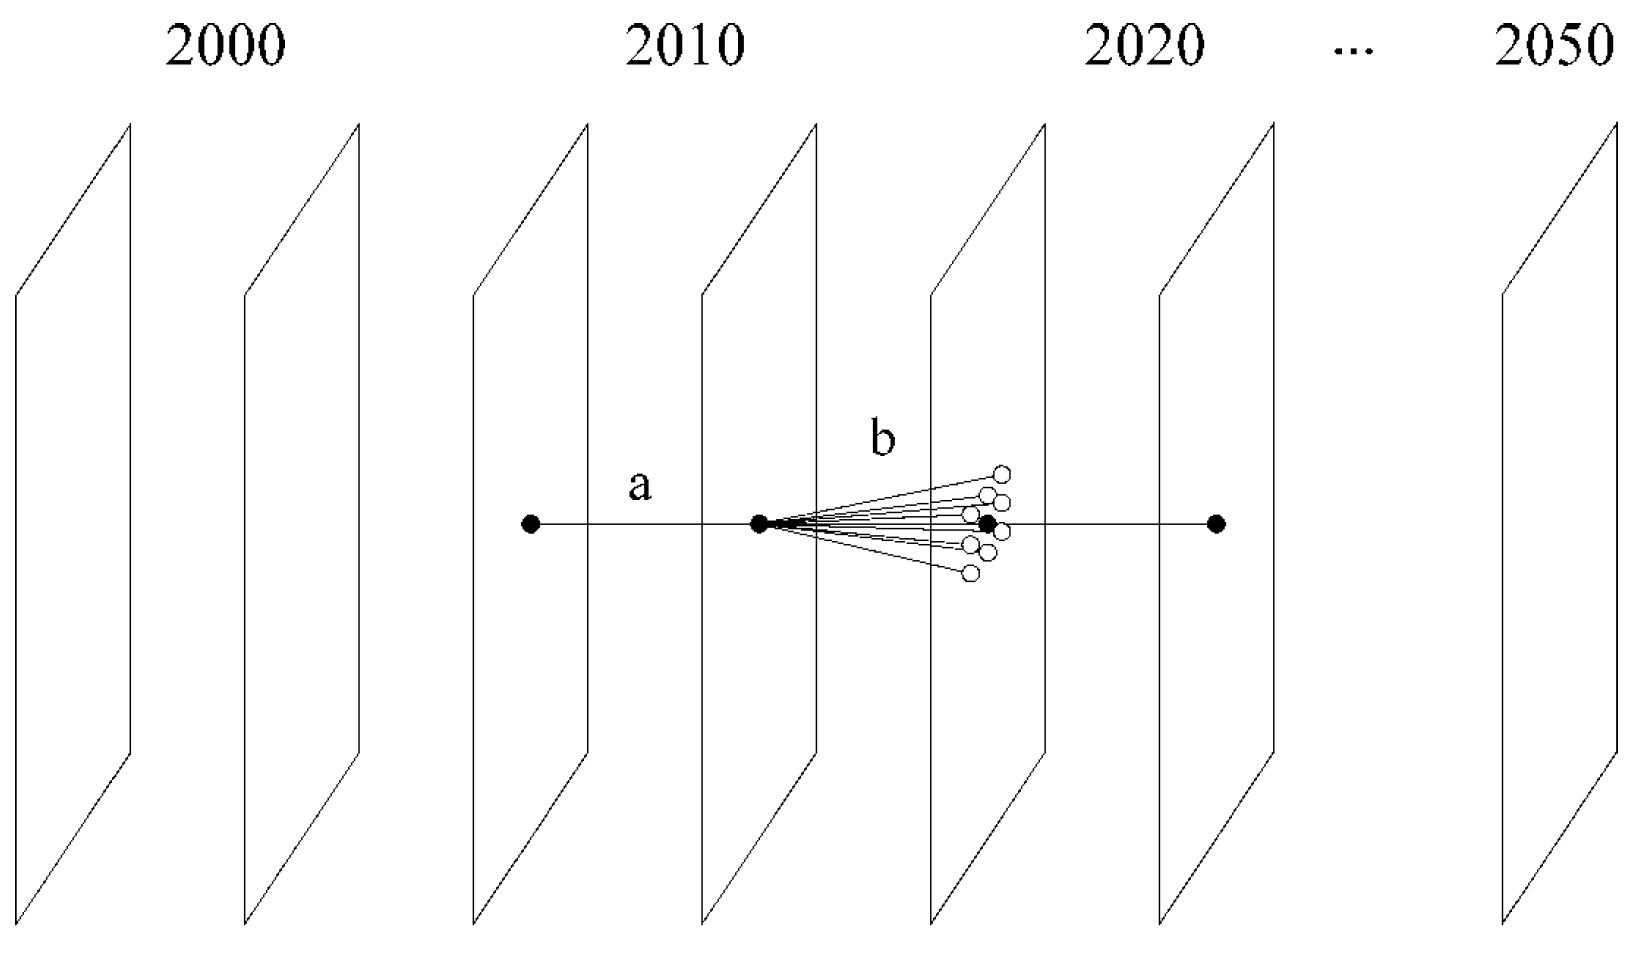
This assumption can be represented as a graph with edges between sites at different steps within the time series (Phillips et al. 2008). Each timestep is used to create two timestep layers in the graph. The ‘within-year’ arcs (a in figure below) that connect the two layers in each timestep represent the probability of survival at that site during that timestep. ‘Between-year’ arcs connect the second layer of a timestep with the first layer of the next timestep. These represent dispersal between sites over time. Between-year arcs connect a site with the same site and adjacent sites at the next time period (b below). The radius within which a site can be considered adjacent is based on the species dispersal ability (Phillips et al. 2008).
From Phillips et al. (2008).
In this type of model structure, the second layer in the final time step will have no outward flow, so all flow values for that layer are zero. The values of interest are those for nodes in the FIRST layer of the first through final time steps.
See Phillips et al. 2008
(link to pdf) for more discussion on interpretation of output of time-series min-cost-max-flow.
The CAT implementation of this function does not include a second aspect of the approach used in Phillips et al. (2008), which simultaneously identifies linkages optimal for conserving multiple species. This method may be incorporated in a future version of the CAT.
See Tutorial Exercise 3 for more information on time-series network flow analysis. The interpretation of output from this function will depend on the biological context, e.g., dispersal ability of species of concern, etc. For species for which the assumption of constrained dispersal is relevant, inclusion of areas of high min-cost-max-flow in a reserve network might be expected to ensure persistence more efficiently than would a focus on the overlap between current and future habitat.