Subset Centrality: Mapping Linkages
Methods used for mapping linkages between a source and target patch represent a special case of centrality analysis, termed subset centrality, which considers paths between the subset of nodes that fall within the source and target patches (Hagberg et al. 2008).
|
Pairwise method
|
Betweenness Centrality (BC)
|
Edge attributes
|
|
Shortest or least-cost path
|
Shortest-path BC
|
Cost; distance
|
|
Current flow
|
Current flow BC
|
Conductance; resistance
|
|
Maximum flow
|
Flow BC
|
Capacity
|
|
Min-cost-max-flow
|
Min-cost-max-flow BC
|
Cost and capacity
|
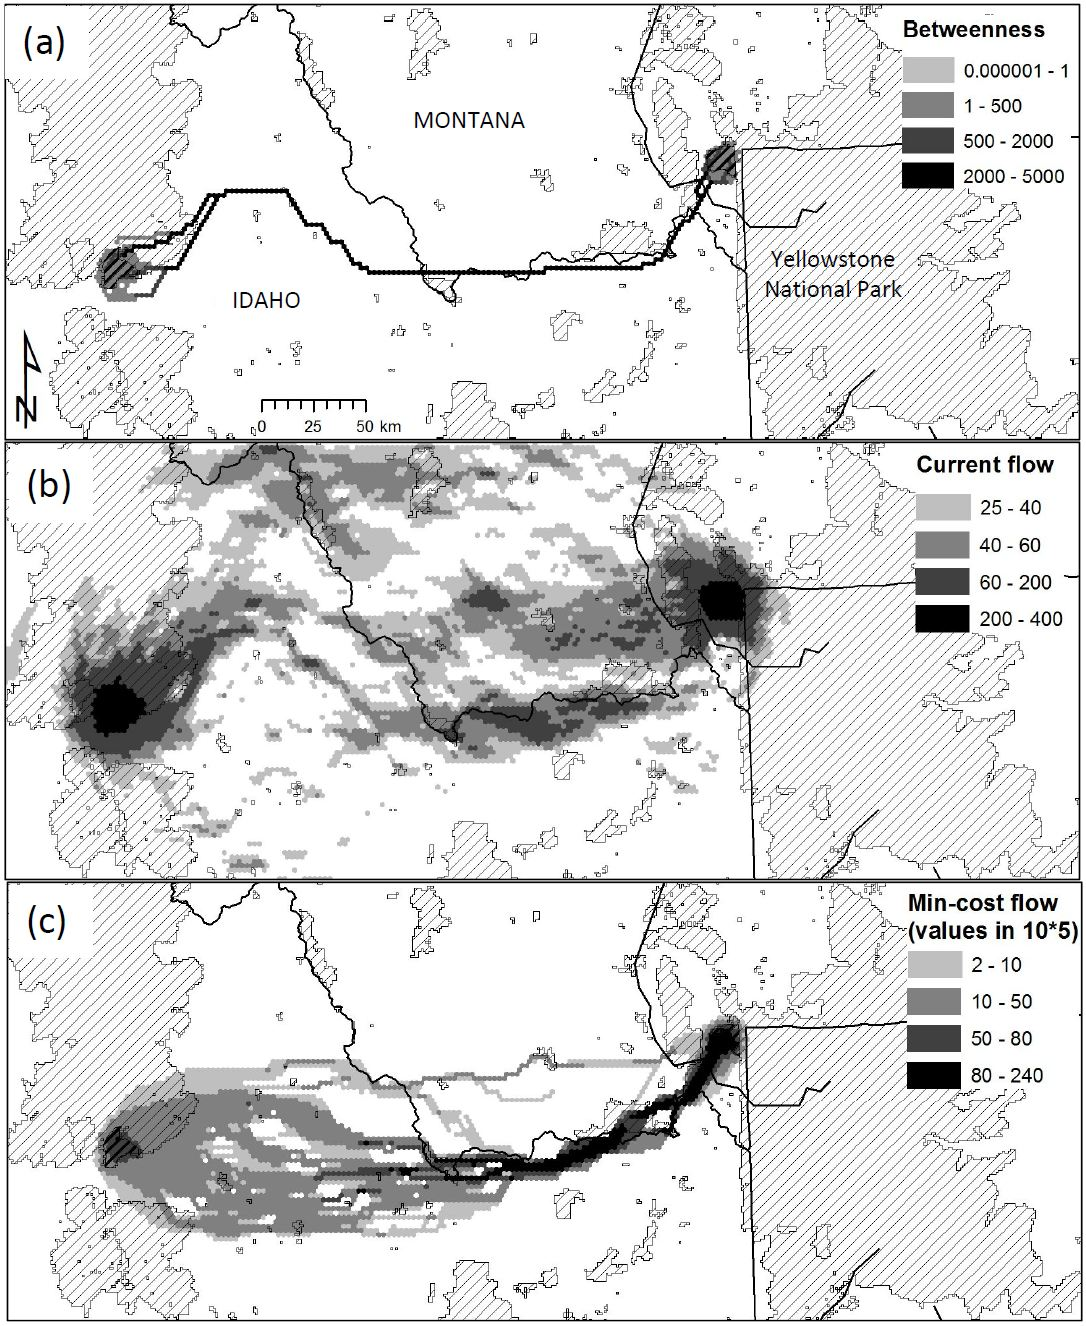
The figure below shows an example analysis of habitat connectivity for wolves between central Idaho and Yellowstone National Park (Carroll et al. in review).
Shortest- or least-cost path betweenness centrality (BC) (shown in a) identifies a minimal network of linkages analogous to those identified by least-cost-path corridor mapping methods.
Current flow BC (b) identifies a more diffuse landscape network that may allow prioritization of redundant linkages.
Min-cost-max-flow BC (c) integrates consideration of both land cost and habitat capacity. In this example, a simple cost value was used that assigned private lands four times the cost of public lands, reflecting common policies that seek to develop options for species conservation on public lands before regulating management of private lands. The results this identify a linkage allowing maximum-flow that lies preferentially on public lands.
We recommend that planning efforts focused on connecting a single pair of core areas (subset centrality) compare results from the 3 methods to identify primary and alternative linkage options. In the example shown below, the comparison suggests it would be informative to evaluate 2 alternative or complementary linkage zones. In minimum-cost-maximum-flow sensitivity analyses, the southern linkage zone, which is longer than the northern linkage zone but contains less private land, received increasing priority as the difference in cost between public and private land increased (not shown). Unlike shortest-path analyses, which may combine land cost and habitat quality into a single aggregate index, minimum-cost-maximum-flow incorporates the 2 as distinct criteria, facilitating such sensitivity analyses.
Figure adapted from Carroll et al. 2011.