Running the Toolkit from the GUI
The Toolkit will typically be run from the GUI (graphical-user interface) by launching the program from a Desktop shortcut or the Start Menu.
The following sections describe how the Toolkit GUI can be used to process data from the input .asc file to the output textfile containing the centrality results.
Note: Some processes can take many hours, and users on multi-core systems may want to initiate a second analysis while the first analysis is completing. Currently this cannot be done by simply switching to another tab of the GUI. In order to start another analysis, the user must launch a second 'instance' of the program by relaunching the program from the Start Menu or Desktop shortcut.
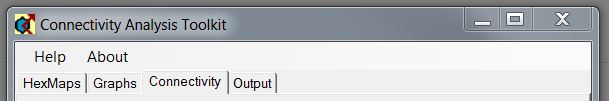
The Toolkit GUI is composed of four primary tabs, as well as pulldown menus to access help information. The standard workflow will progress from the left to right tab, from hexmap and shapefile generation to graph generation, connectivity analysis, and output to a csv format textfile.
Hexmaps
This tab allows generation of hexmaps and shapefiles from input raster data (.asc files).
Graphs
This tab allows generation of graph format files from hexmaps.
Connectivity
This tab allows application of the connectivity analysis methods to the graph format files.
Output
This tab displays information on the progress (completion, error messages, etc.) of the functions occurring in the other tabs.
Help and About Tabs
Access the Help menu and About tab here. The help information accessed here is identical to that present in the pdf manual.